How to navigate the Eurospot page
In this article, we will guide you through the Eurospot page within Montel Online and explain the different components.
The Eurospot page covers current and historical spot prices, allowing you to analyze short- and longer-term historical trends, compare spot prices across price zones and time intervals, and download a vast repository of historical data.
The Eurospot page can be found by navigating to "Power", "General" and "Eurospot".


1. Overview Chart
On the left side, you can find the "Overview Chart", which enables you to compare different spot prices in different time resolutions and currencies using the drop-down menu. Click "update" to display changes. In addition, you may export the data to Excel using this icon: 
If only one spot is selected, you may compare different hours with each other, for example, Base and Peak hours in the same chart. This feature also includes running averages.

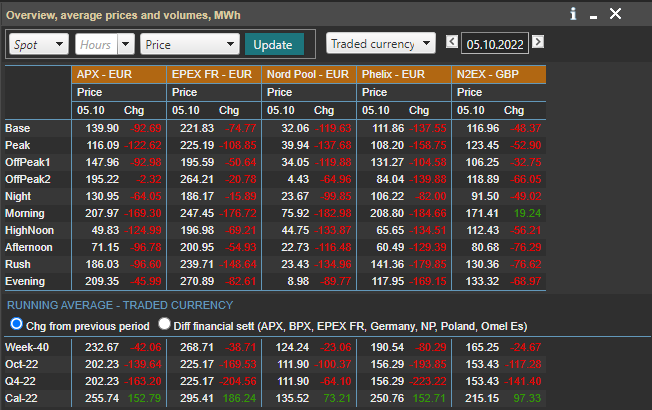
2. Overview, average prices, and volumes, MWh
Compare time blocks from different spot markets. Select spot markets (left), desired blocks (middle), and time intervals (right).
Within this column, you will also find the Running average traded currency, which showcases the average of the week, month, quarter, and year. Here you can calculate averages for up to five spots, for any time interval. Click "update" to view changes.

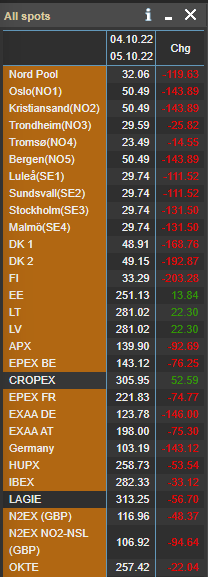
3. All spots
The "All spots" table includes an overview of all day-ahead prices.
When the Spot prices are highlighted in orange, the prices have been updated. Furthermore, by navigating to the information icon you will get an overview of when the different prices will be updated.

4. Calculated averages
You can calculate averages for up to five spots, for any time interval.

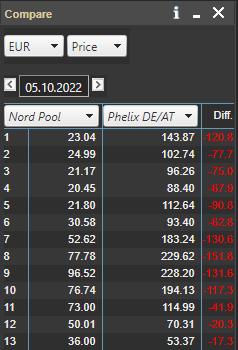
5. Select and Compare
Select and compare the hourly price differences between two exchanges.


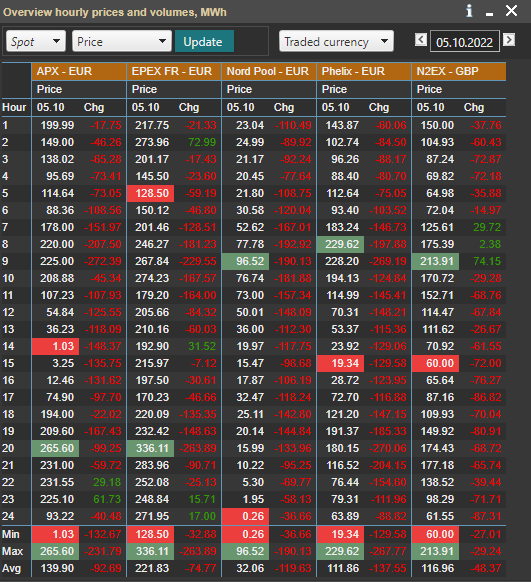
6. Compare hourly prices and volumes, MWh
Compare hourly prices and volumes between several exchanges for any given day, and the change from D-1.

View Spot vs financial settlement for key markets.
![Montel_logo_pine_300ppi (1).png]](https://support.montel.energy/hs-fs/hubfs/Montel_logo_pine_300ppi%20(1).png?height=50&name=Montel_logo_pine_300ppi%20(1).png)